As one of Riverlane's first design interns, I was given the freedom to direct my own project direction and write my own brief. After onboarding and observation, I chose the topic of decoding graph visualisations to explore as I remember seeing these complex diagrams around the office and being fascinated by their use. The final project outcome was an interactive decoding graph visualisation tool to improve Riverlane employees' understanding and communication of the rotated planar code.
"A decoding graph is an important mathematical object in the field of quantum error correction - it represents the decoding problem that is passed to a decoder."

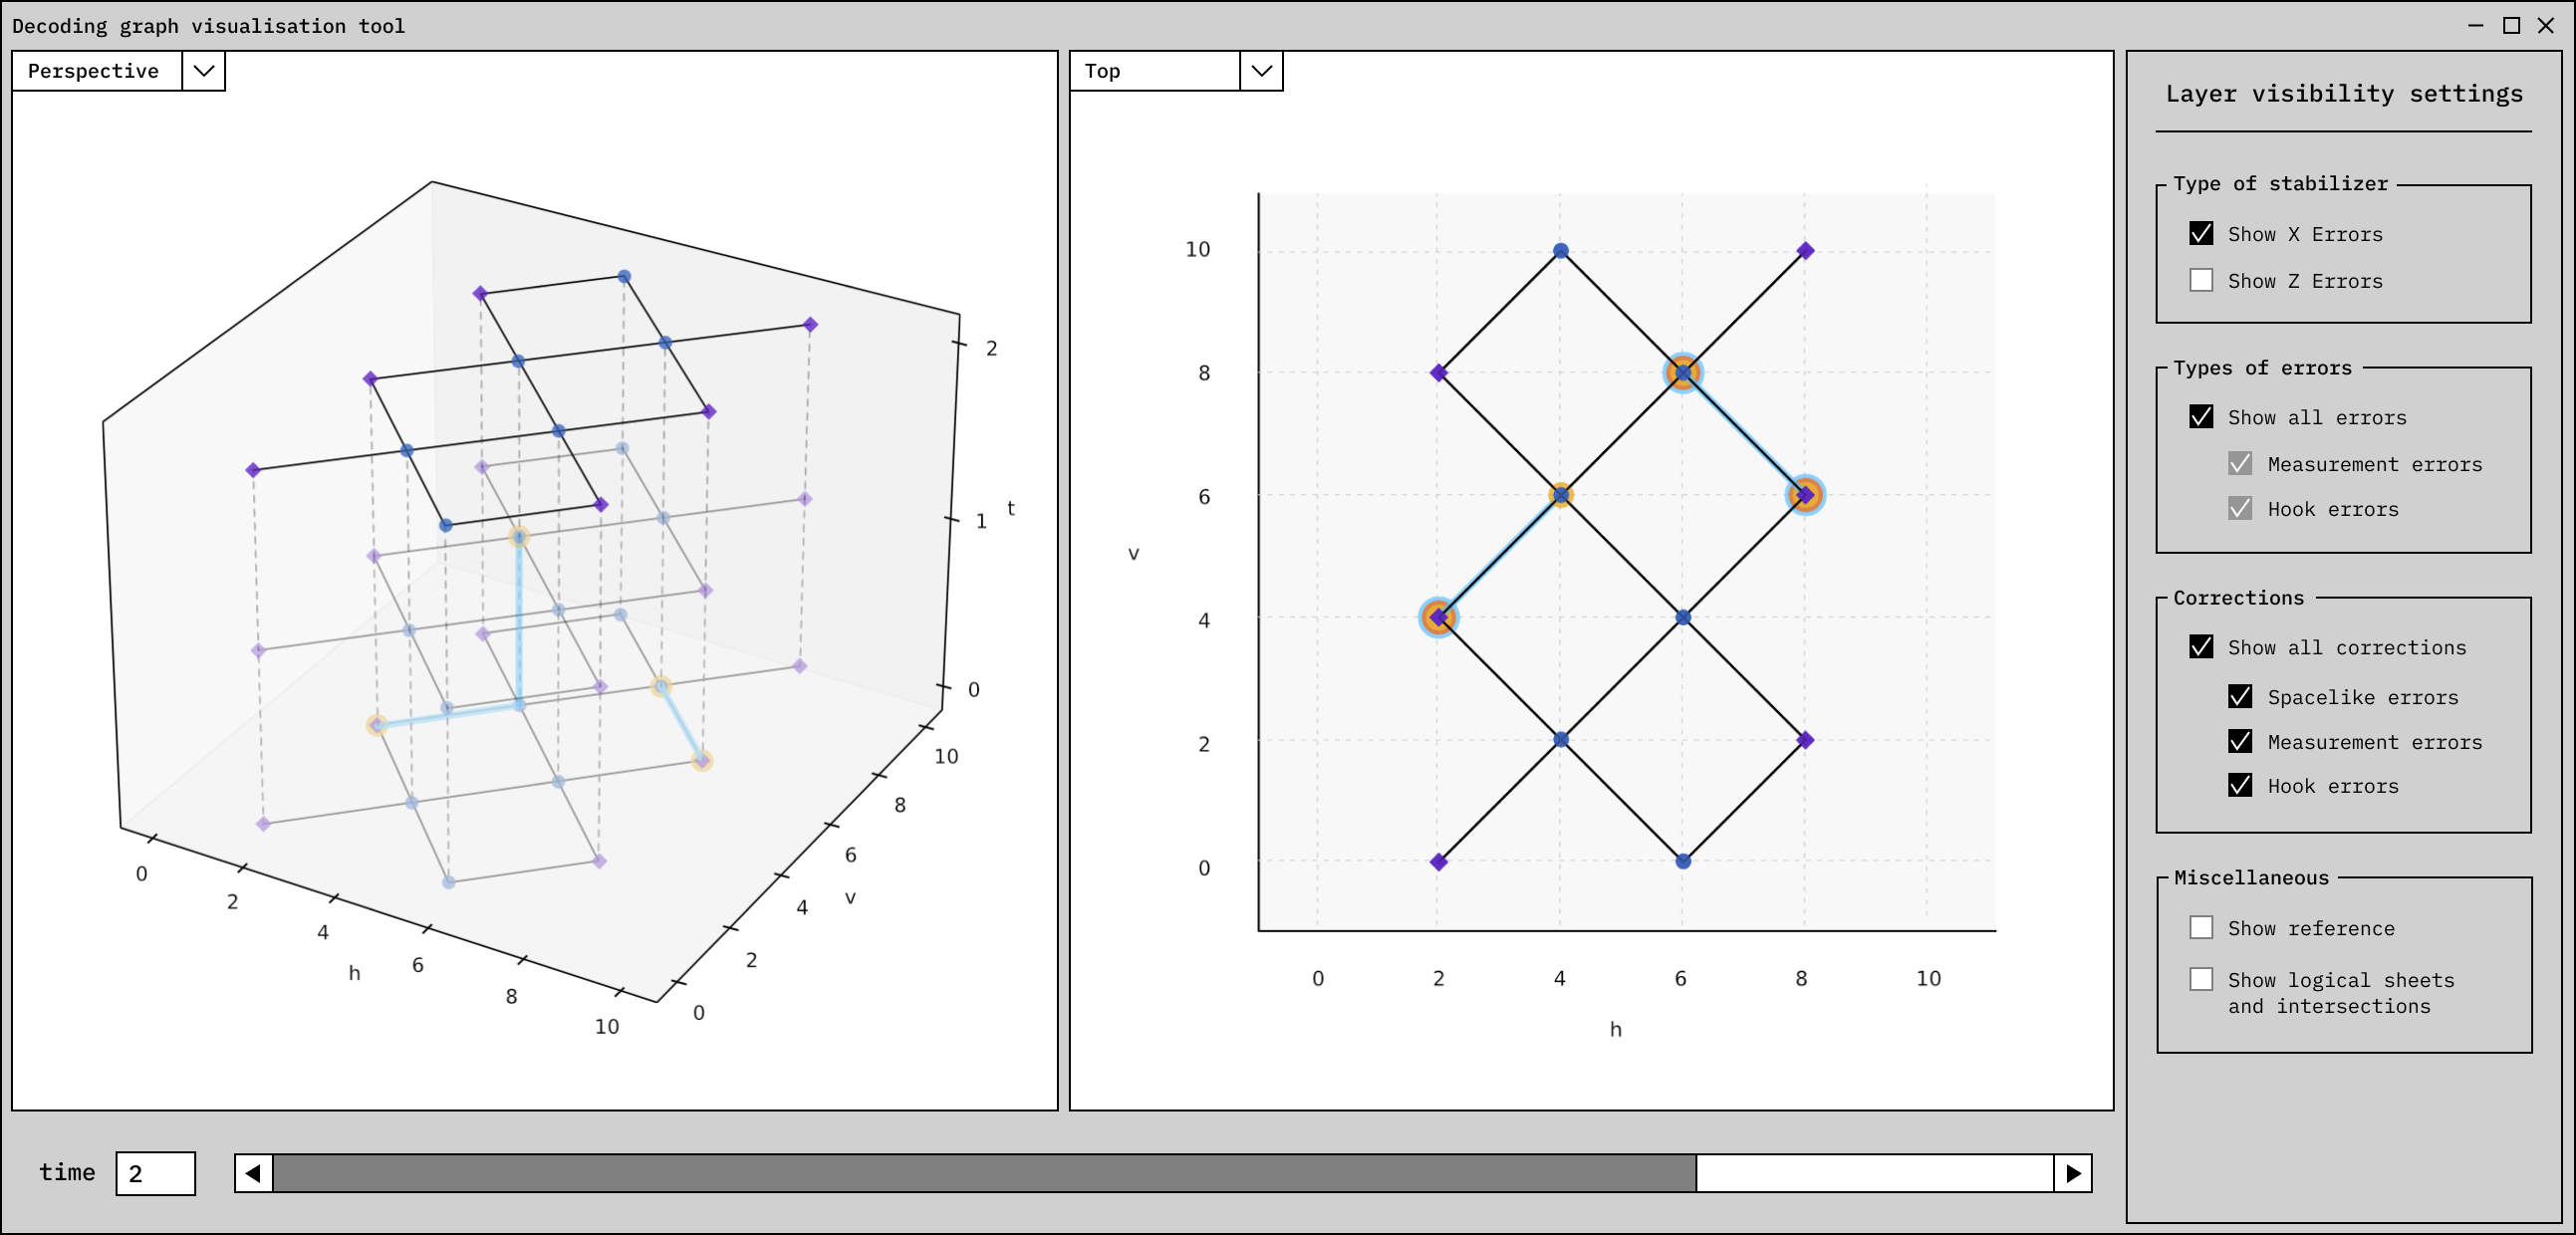
Most of the decoding graphs that I saw were either far too complex to make sense of, or very simplified, and I wanted to find a way to make larger distance graphs, which were more realistic for day-to-day testing, far more readable and understandable. I regularly spoke with quantum scientists and engineers to understand how they used existing tools to aid their understanding of a decoding problem. This involved looking at their notebook sketches, interviewing them, and at one point organising a codesign workshop to test their ideas. I also kept iterative feedback loops short, testing out early drafts of feature ideas with scientists and getting their input regularly.
Despite having no prior background in quantum at all, I enjoyed working with the scientists and learning to speak their language of technical jargon and also learning Python. This helped me translate both technical and user insights into an interactive Figma prototype and a final recommendation for development. I also wrote some articles for internal use, documenting my design process and explaining my learnings. At my final internship presentation, I received much positive feedback that it would help both experienced scientists and laymen as a communication and educational tool.
As my work is now under Riverlane IP protection, I cannot disclose more detailed information about this on my website.